What is it?
An Ishikawa diagram (also known as a fishbone diagram) is a tool used to identify and organise possible causes of a problem. It looks like the skeleton of a fish, with the ‘head’ representing the problem, and the ‘bones’ showing categories of potential causes. This tool helps teams brainstorm and explore all possible reasons behind an issue before deciding on solutions.
Why do we use it?
Visual Representation
Provides a clear visual map of potential causes, making it easier to understand the problem and its contributing factors.
Root Cause Analysis
Helps in identifying the root causes of a problem rather than just addressing symptoms.
Teamwork and Collaboration
Facilitates group brainstorming and discussion to identify and analyse causes.
Improvement Planning
Provides a framework for developing targeted solutions and action plans.
Applying an Ishikawa Diagram to a Health Service Challenge
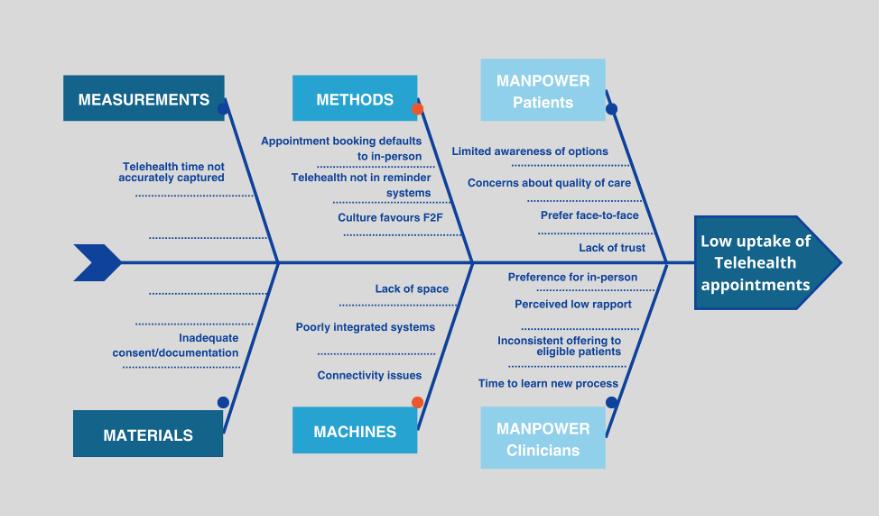
Case Study: Telehealth Uptake
In metropolitan health services, allied health clinicians often provide telehealth as a convenient option for follow-up appointments. Despite being clinically suitable, many patients continue to choose in-person visits. This trend contributes to unnecessary patient travel, car parking congestion, pressure on clinic space, and reduced appointment availability for others.
Step 1: Define the Problem
Problem statement: Low uptake of follow-up telehealth appointments
Step 2: Identify Major Categories
The team identified primary categories of causes using the ‘5Ms’:
- Manpower – patient factors
- Manpower – clinician factors
- Methods – Processes
- Machines
- Materials
- Measurement
Step 3: Brainstorm Possible Causes
Manpower (patient factors)
- Limited awareness of telehealth options
- Preference for face-to-face interaction
- Concerns about quality of care through telehealth
- Lack of trust in telehealth (past experiences)
- Misinterpretation of purpose of telehealth
Manpower (clinician factors)
- Clinician preference for in-person reviews
- Inconsistent offering of telehealth to eligible patients
- Perceived lower rapport via telehealth
- Risk aversion (not able to provide full scope)
- Negative past experience
- Time required to learn a new process
- Lack of privacy / confidentiality concerns
- Preference to stick with what they know
Methods (Process & Policy)
- Appointment booking defaults to in-person
- Telehealth not promoted in reminder systems
- Clinic culture favouring face-to-face interviews
Machines
- Lack of dedicated space to conduct telehealth appointments
- Poorly integrated telehealth systems
- Connectivity issues / unstable Wi-Fi
Materials
- Inadequate consent and documentation tools
Measurement
- Telehealth time not accurately captured
Step 4: Review and Organise
The team removed duplicates, grouped similar ideas together and highlighted the most likely causes.
Step 5: Problem-Solving
The team used the completed diagram to discuss which causes seemed most significant.
How to Create an Ishikawa Diagram
Define the Problem. Write a short, clear statement of the problem. Place this at the head of the diagram.
Identify Major Categories of Causes. Decide on the main categories that may be contributing to the problem (e.g. the 5Ms – see below). Add these categories as the main branches of the diagram.
Brainstorm Potential Causes. Brainstorm potential causes for each category. Add these as the ‘bones’ of the spine. Ask “Why might this happen?” to identify additional causes.
Analyse and Prioritise. Remove duplicates and combine similar causes. Group similar ideas together. Identify the causes that seem most important or likely.
Prioritise and Plan. Discuss which causes have the greatest impact. Use data, evidence, or team consensus to prioritise what to address first.
lightbulb Tip
menu_book Learn More
Create your own Ishikawa Diagram
Use the interactive diagram below to create your own Ishikawa analysis. The 5Ms categories have been pre-populated — edit them or add your own categories and causes.